Ocean Current and Wave Motion near Trindade Island
Reconstructing the sea surface conditions around Trindade Island would be impossible without computer modelling using comprehensive metocean data for the whole of the South Atlantic on 16 Jan 1958. In the absence of reliable data, this is a very tentative attempt to infer likely conditions, taking account of permanent currents, local winds, wave refraction etc. The purpose is to check whether the 50m wave displacement measured from the photographs (as reported by Brad Sparks) is consistent with likely wave direction and speed. If consistency is found then this exercise would also serve to constrain the elapsed time, which could then be compared with values derived independently from estimates of cloud displacement.
Introduction
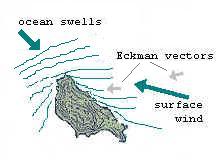
Surface water motion is governed by wind friction currents, thermal/density currents, the Coriolis pseudo-force due to the earth's rotation, and the shape of the ocean basins. The predominant factor is wind friction. The coupling of wind and water causes, and at the same time is caused by, surface waves, and is therefore proportional to wave height. The surface layer thus governed is called the Eckman layer, from tens to hundreds of metres deep.
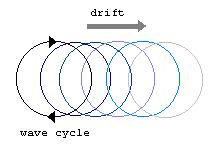
Waves produce a surface mass transport by an incremental inching-forward of the rotational wave motion (Fig.1). The energy of the wave oscillation is propagated much faster than this mass transport or 'wave drift' but in the same direction.
Fig.1. The wave is a trochoidal displacement of particles from crest to trough. The mean horizontal position of a water particle changes only slightly from cycle to cycle as a train of waves propagates through. This small change is the mass transport or drift.
Although driven by the wind, the Eckman mass transport at the surface is in general not in the direction of the winds but at an angle, due to the Coriolis force. In deep water the actual deflection represents the geostrophic balance between a theoretical Eckman deflection of 90° and the restoring force of gravity on the water that is 'piled up' on the inside of the current curve or gyre. In the N hemisphere the amount of this deflection at the surface is up to 45° to the right of the wind, in the S hemisphere up to 45° to the left. In shallow water it reduces towards about 15°. From the surface to the bottom of the Eckman layer the direction of this deflection rotates through the 'Eckman spiral' until at the bottom of the layer it actually becomes a weak opposing countercurrent.
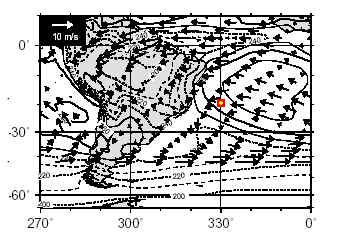
The prevailing surface wind in the Trindade area is a rather steady band of light winds that comes across the S. Atlantic from near the coast of Africa, varying little from SE/ESE, similar to the wind field for 850 hPa shown in Fig.2. The surface wind recorded in the log of the Almirante Saldanha for the morning of 16 January 1958 was light from the SE. The classification 'light' is #1 on the international Beaufort scale for weather observers corresponding to 0.6 - 1.7 m/sec, or 1 - 3 knots. A 'slight' breeze, #2, would be 1.8 - 3.3 m/sec or 4 - 7 mph. Allowing for some uncertainty in translation we have a motion of maybe one or two metres per second.
(For reference, high resolution surface windplots of the Espirito Santo Basin area for 15 Jan 1999 are 5-7m/sec [10 - 14 kts, or 12 - 16 mph, or a 'moderate breeze' of Beaufort #4] with significant wave heights of 1.2-2m; surface winds in October average about 12 m/sec [24 kts, or 27 mph, or a 'strong breeze' of Beaufort #6] with wave heights of 6-8m. [Robertson & Mechoso. 2000] The 'significant wave height' is a statistic based on averages of the heights and periods of the highest one-third of the waves measured during a standard interval.)
|
Fig.2.
S. Atlantic 850hPa wind vector field, 40 year averages
(after Robertson & Mechoso, 2000)
The Eckman transport at the surface corresponding to these winds would be roughly towards the W or WSW. One might think, then, that this would imply a wave motion towards the W, with swell crests aligned normal to that direction. But the implied motion of the wave group measured from Barauna's photographs P1 and P4 is opposed to this, approaching the ship from the NW in direct opposition to the local surface wind.
This could be taken to indicate that the photos were hoaxed, or that Barauna confused the sequence (not impossible - after all, the negative strip was cut). But if we reverse the order of the photographs the discrepancy from the expected broadly E-W Eckman current is only reduced slightly, from 180° to 135°. Moreover, this substitution would reverse the directions of the cloud displacements, both for the high stratiform and low cumulus clouds, which would in both cases conflict with the prevailing wind directions.
Brazil Current
In fact we can show that the sequence as reported could be consistent both with the ocean surface movement and with the wind directions. The explanation for this is the Brazil Current.
Part of the warm South Equatorial current flowing to the west is forced south where it meets the continental shelf of South America at about 10°S, and comes down the coast of Brazil as the Brazil Current. This fast boundary current dominates the top several hundred metres of the water column over an area which on average extends out to and somewhat beyond Trindade. South of Trindade (at around 22°S) it begins to diverge, with one branch curling E and a narrower jet hugging the coast down to about 35°S where it collides energetically with the cold Malvinas Current. The easterly extent and direction of the Brazil Current varies slightly on seasonal and longer timescales, and local anomalies occur due to interactions with other currents and subsea geography. But essentially the Brazil Current is a permanent feature of the global ocean conveyor with an analogous climatic function to that of its stronger N hemisphere cousin, the Gulf Stream.
In the open ocean to the east of Trindade, down to about 22° or 23°S, the velocity vector fields (see Fig.3 below) show a current flowing W or WSW, matching the expected Eckman current due to the long cross-Atlantic fetch of the prevailing SE or ESE wind band. But around the longitude of Trindade this flow is disrupted where it meets the eastward-trending branch of the Brazil Current whose momentum dominates the surface flow in the region of the Vitoria-Trindade seamount chain, giving way to a surface current whose mean set near the island in January will be roughly N-S.
Waves far from the generating area of a current may have been reflected and refracted by coastal boundaries by the time they are encountered and no longer bear any relation to the orientation of the originating fetch. In this case the wind circulation down the Brazil coast tracks the current to some degree, but obviously the streaming of the sea current by the coast is an overwhelming constraint not shared by the wind, and thus the wind-wave coupling is weakened. Also the breaking away of an eastern part of the Brazil Current to form an anticlockwise recirculation cell south of Trindade is in part a response to its collision with the opposing Malvinas Current. For these reasons the Brazil Current vector in the Trindade region has become at least partly decoupled from the wind, and the net current at Trindade is some tens of degrees to the left of the expected Eckman transport due to the local wind.
mean surface velocity vectors Oct/Nov/Dec
mean surface velocity vectors Jan/Feb/Mar Fig 3. The Brazil Current. The water transport in the top few hundred meters of the ocean at Trindade is dominated by the Brazil Current, a branch of the South Equatorial Current. This is a permanent current analogous to the north hemisphere Gulf Stream. The current transports warm water south along the coast of Brazil and has a maximum rate in the south hemisphere summer, Dec/Jan. (Adapted from http://oceancurrents.rsmas.miami.edu/atlantic/brazil.html, HYCOM Ocean Surface Currents project, Rosenstiel School of Marine and Atmospheric Science, University of Miami) |
Obviously the vector sum of momenta of all mass transports is the local net current, subsuming all these individual drift components. But the net current does not identify a net direction of wave propagation. To understand the interaction of current and winds in these circumstances we need the concept of a wave spectrum.
The various components of the local wave spectrum can include components due to such things as distant storm surges as well as local winds and global currents, and to a lesser extent effects due to tides and temperature/salinity fluctuations. Where these components interfere, some will be cancelled, some reinforced. Other waves will appear which are secondary intermodulation products. Modern wave forecasting uses computer models to sum as many as 30 or more different wave directions. Each component is predicted according to the varying conditions over time in the generating fetch and its distance from the area, which allows dispersion relations to be used to calculate the frequencies, velocities and amplitudes of arriving waves. These many different waveforms are then superposed and harmonic analysis generates a model of the resultant wave spectrum in the region to simulate what happens in reality. The mix of many different waves from different directions generates the complex wave spectrum of the sea surface with its self-similar pattern repeated on many different scales.
So the current trend shown in Fig.3 is the vector sum of all mass transport at the sea surface, but is not a unique direction of wave propagation. There will for example be patterns of smaller, slower, higher-frequency waves associated with the SE fetch of the local surface wind. The displacement of a given pattern will then be the vector sum of the current transport velocity and the velocity of the wave crests in the pattern.
Direction of wave-pattern displacement
The mean seasonal current (N-S) is not necessarily the actual current, of course, but I have not been able to find data on the standard deviation from the mean of the Brazil Current vectors. It is true that the deeper and faster western boundary currents, of which the Brazil Current is one, are said to be especially prone to meandering, sometimes hundreds of kilometers from their average positions, and their shifts also give rise to transient eddies and ring currents. These features can be strong enough to locally reverse the direction of the parent current.
One noteable effect is due to the southernmost meanders of the South Equatorial current itself. These meanders sometimes get reflected by the Vitoria-Trindade seamount chain, causing a "cyclonic gyre" centered on a region a few degrees WNW of Trindade (Stramma et al., 1990; Memery et al., 2000) A cyclonic rotation in the S hemisphere is clockwise, so one can readily imagine that in these conditions the normal northerly or nor-norwesterly flow would be deflected, coming towards Trindade from a more westerly direction. Actually this might accord well with the apparent NW-SE displacement of the wave group as measured from the photographs.
Most of the net water momentum locally will be in the direction of long-wavelength ocean swells with periods of the order of 10 secs associated with the Brazil Current, relatively little in the shorter, slower waves with periods of a couple of seconds, and almost none in the smallest capillary waves. So we would expect to see a bulk displacement of the surface moving roughly from NW-SE associated with long swells, carrying on its back a more chaotic superimposed complex of smaller and shorter waves propagating in various directions, principally that of the Eckman transport due to the prevailing local SE wind.
But if most of the water momentum is in the current coming from the far side of the island, flowing towards the SE, how come the photographs appear to show surf breaking vigorously on the island from a broadly easterly direction when the SE winds were light? This can be understood as due to the local wave motion augmenting the effect of wave refraction on the ocean swells.
|
Fig.4. Schematic relationship between swell refraction and incidence of local Eckman vector
As the shoaling swell crests approach the island from the north their shallow-water portions are beginning to 'feel' the seabed, which slows them until the phase speed and group speed begin to equalise at the shoreward end. The resulting wave refraction bends the orientation of the crests around so that they tend to parallel the rising submarine contours and try to conform to the coastline (Fig.4). As the swell crests bend round towards the shore they cease to be in opposition to the local Eckman transport vector and the closer they approach the shore the more they begin to pick up energy from it, which reinforces their tendency to conform to the coastline.
As mentioned the Eckman transport due to winds would be towards the WSW in the deep sea. But in fact close to the island, where the water depth is decreasing due to the rising subsea shelf on which the island sits (the depth in the area measured is only some 15m and therefore probably much shallower than the Eckman layer) the deflection at the surface will tend to reduce, from 45° in the deep ocean to as little as 15° in the shallows. This would tend if anything to swing the inshore wave transport round clockwise towards the wind direction as it comes in behind the refracted swell crests. Thus swells near the island are turned preferentially inshore, carrying the local waves with them, and energy from the light SE breeze is added directly, just when the heights of the shoaling waves are increasing to offer a greater area to the wind. So waves break quite vigorously in the surf zone on the E shore, whilst further out the effect of refraction on the swell crests diminishes until they realign with the dominant long-range current whose gross transport remains towards the SE.
In summary, the NW-SE direction of wave-pattern displacement implied by the photographs in a region several hundred metres offshore is not necessarily inconsistent with the recorded surface wind, with the evidence of a surf zone on the E shore or with the likely general current direction.
Speed of wave-pattern displacement
The mean rate of the Brazil Current is given as 50-60cm/sec at the Seamount Chain (Evans, 1983). Permanent ocean currents can have peak rates up to 250 cm/sec in the top 200m (Cooper, 2002), and I have found rates in parts of the Brazil Current reported as high as 128 cm/sec, or about 2.5 knots (NIMA). There is thus some uncertainty in the rate near Trindade.
It is possibly somewhat below the mean value given for the latitude of the Vitoria-Trindade seamount chain. This is because Trindade lies at the E margin of the current and the fastest rates will occur in the jet flow near the coast. Recorded peak rates >120 cm/sec are roughly twice the mean rate. Proportionately, if the drift rate at Trindade is near the minimum rate then it could be as low as (say) half the mean, or ~27 cm.sec. But statistical variability of the current in time and space makes it unrealistic to take much account of the deviation from the mean.
Given the uncertainty, if we take the mean current rate of 55 cm/sec and place it within a broad ± factor-4 error bar to give a range of about 14-220 cm/sec (spanning from about 25% of the cited mean rate to 170% of the cited peak rate) we can have some confidence in it.
The rate of displacement of a given wave pattern will therefore be the vector sum of this current and the group speed of superficial waves generated on top of the water column due to a light air movement on the order of 1m/sec. This superficial group-speed drift will be less than half of the phase-speed of the waves, therefore much less than half the driving wind speed. So it ought to be small in relation to the mean of our error bar (117 cm/sec) but with a component of motion in opposition to the inferred NW-SE ocean current vector. In summary we ought to expect the wave pattern displacement to be broadly in the direction of the ocean current vector but perhaps a little slower.
For illustration, note that if the wind-driven wave pattern displaces at fully half the likely surface wind speed (~50 cm/sec) then the mean of our error bar still represents the expected wave displacement rate within only a factor-2 error if the true current rate is >80% of the measured peak rate of the Brazil Current.
Conclusion
In a study of cloud displacements it was found that different values of the time elapsed between P1 and P4 could be determined approximately for different sets of plausible assumptions. Since the altitude of the cloud patterns matched is not known there will be broadly-speaking two overlapping ranges of values depending on whether the stratified cloud is cirrus near the freezing level at ~35,000' or is much lower altostratus.
With the former assumption, wind vectors derived from Brazilian Navy computer models for a control date in January 2004 suggest a minimum time of 2 minutes. This assumes the strongest (80 kt) winds shown for 33,000' anywhere within the Trindade sea area on the control date, and is on that account statistically unfavoured for Jan 16 1958. On the other hand it is also statistically unlikely that the control date should happen to lie at one extreme of the range of variation. Presumably 80 kt may not be the maximum possible ~33,000' January wind speed in the area.
However, if the cloud concerned is lower altostratus, say at 20,000' or below, then one can show that any windspeeds greater than about 45 kt would drive down the elapsed time below the 2 minute mark. (I have not located appropriate January windplots for this level, but note that an increase of less than 2 kts per thousand feet of altitude from a typical 10 kt surface wind is not an extreme gradient.) That there are strong winds at the relevant altitude is indicated not merely by the bulk cloud displacement but by the internal appearance of the cloud itself, which (particularly in the last photo, P4) is "smeared" and striated in a direction consistent with the prevailing SSW high-level winds. The pattern displacement is also consistent with this direction.
In the absence of balloon soundings for the date in question all we can say is that about 2 minutes is not an unreasonable guess. This gives us a value to cross-check against the wave-pattern displacement measured from the photographs by Brad Sparks.
Sparks has remarked that wave-pattern analysis ought to be more reliable than cloud-pattern analysis in constraining the time because at least the distance to positions on the sea surface can be known with fair accuracy. This is true in principle, but each of the two components of wave velocity (direction and speed) turns out to be sensitive to many factors, and the present study hints at just how complicated the oceanographic theory underlying those factors is. It isn't clear that this tentative analysis of wave motion has been able to much improve on the time constraint derived from cloud motion. On the other hand, the two approximate results both increase in value from the fact that they are arrived at by independent methods and so can to some degree be used to callibrate one another.
In summary, it is easy to show that in 2 minutes the mean current rate of 55cm/sec given above would bulk-transport the surface layer a distance of 66m. As stated, the resultant vector due to this current and the group speed of superficial waves due to a light air movement on the order of 1m/sec might be somewhat less, and therefore in 2 minutes the wave-pattern displacement might be somewhat less than 66m in a roughly NW-SE direction.
This is consistent with Sparks' finding for the displacement of the wave pattern. Sparks reports that a pattern identifiable in P1 and in P4 moves from azimuth 320° to 324° and from horizon elevation -4° to -6°, corresponding to approximately 50m travel in the direction of the ship from a range of 150m to 100m.
It would be reasonable to object that this close match can only be fortuitous given the degree of uncertainty in the model. Accordingly, if we revert to the mean measured surface current rate of 55cm/sec within our conservative ± factor-4 error bar, then this allows us to absorb both the relatively small uncertainty due to local winds and the entire range of variability of the Brazil Current so as to place the likely duration within brackets of approximately 20 - 360 secs. The difference between the mean of this range (190 secs.) and the figure derived from cloud-pattern analysis (120 secs.) is about 20% of this bracketed range.
It is interesting that two quite distinct types of measure - cloud-pattern and wave-pattern displacements - produce a very rough consistency with regard to the direction and magnitude of both wind and water movements, in each case suggesting that the elapsed time of photography was in the range of a few tens to a few hundreds of seconds. Nevertheless there is a large margin of uncertainty, and there are too many reservations to regard this analysis as reliable. To date the hoax hypothesis remains unproven. Hopefully some future analysis may be able to check these inferences against more detailed metocean data for Jan 16 1958.
© M.Shough 18.09.04
references
Cooper, G., 'Ocean Currents', presentation to the OGP Metocean & Engineering Technology Requirements for Floating Systems Workshop, Banff, Canada 2002.
Evans, D.L, S.S. Signorini and L.B. Miranda, 1983: A note on the transport of the Brazil Current. Journal of Physical Oceanography, 13, 1732-1738.
HYCOM Ocean Surface Currents project, Rosenstiel School of Marine and Atmospheric Science, University of Miami, http://oceancurrents.rsmas.miami.edu/atlantic/brazil.html
Roberston, A. W. and C. R. Mechoso, 'Interannual and interdecadal variability of the South Atlantic Convergence Zone', Mon. Wea. Rev., 128, 2947-2957, 2000.
Memery, L., M. Arhan, X.A. Alvarez-Salgado, M-J. Messias, H. Mercier, C.G. Castro, A.F. Rios, 2000: The water masses along the western boundary of the south and equatorial Atlantic. Progress in Oceanography, 47, 69-98.
NIMA, US National Imagery & Mapping Agency, Ocean Currents, Chapter 31, p.434.
Sparks, Brad, message post at http://www.virtuallystrange.net/ufo/updates/2003/nov/m28-016.shtml archive: Re: The Big Global UFO Secrecy Agenda - Date: Monday, August 16, 2004 3:09 PM
Sparks, Brad, personal communications.
Stramma, L., Y. Ikeda, R.G. Peterson, 1990: Geostrophic transport in the Brazil Current region north of 20°S. Deep-Sea Research, 37 (12), 1875-1886.