|
The Trindade Island photographs, 16 Jan 1958
A
Preliminary Study of Cloud Displacements
(Feb
2004. Last update 25 Feb 2004)
(index) part two (< Back to Part 1)
Wind vectors in the Trindade Island area
In the absence of local upper-air weather data for the time and place the following is an attempt to assess the likely range of variability of conditions based on long-term averages from 1958-1997 and a detailed Brazilian Navy Hydrographic Centre computer model for January 2004.
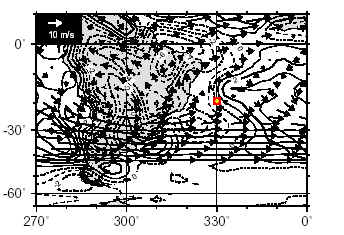
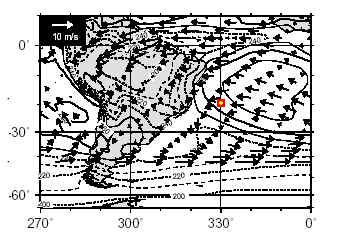
The wind fields in Figs.12 and 13 show the mean Jan-Feb-March vectors at 200 hPa and 850 hPa over the S.Atlantic averaged over 40 years from 1958 -1997 (Robertson & Mechoso, 2000). These levels are around 4,500' and 45,000' respectively. The position of Trindade Island is indicated by a coloured marker.
|
Fig 12. 200 hPa S.Atlantic wind field (after Robertson & Mechoso)
|
Fig.13. 850 hPa S.Atlantic wind field (after Robertson & Mechoso)
The 850 hPa vector field at a few thousand feet maps the prevailing SE trades in the region of Trindade. These prevailing easterlies are generated off the west coast of Africa and form a trans-Atlantic band of surface winds with seasonally varying speeds of around 4-6 m/sec. By contrast the high level 200 hPa vectors (close to the likely tropopause) show southerly or westerly winds in the region of Trindade.
On average, therefore, one ought to expect that in January lower tropospheric cumulus will tend to recede generally W or NW; high tropopausal cirrus will tend to move transversely, or generally N or NE. Qualitatively speaking this vertical wind shear is not inconsistent with the displacements inferrable from the features of photographs P1 and P4. The lateral angular displacement of the high cirrus towards the right, or generally N, is several times as large as that of the low cumulus, whereas the vertical angular displacement of both cloud groups is roughly comparable. If one neglects possible vertical motions (these are considered later) and crudely projects these angular rates as horizontal vectors they translate to this result: The high cirrus has a larger real ground speed in a transverse N or NE direction than the low cumulus; the low cumulus has a larger real ground speed in a line-of-sight NW direction.
In summary, the difference in the vector components of the displacements of the two cloud types between P1 and P2 matches qualitatively the difference in the expected mean wind field vectors for the two appropriate altitudes derived from 40-year averaging of the wind data for the area of sky photographed.
High level winds
The rate of horizontal displacement of cloud features will obviously be proportional to horizontal wind speeds. If the match of cirrus features in P1(a) and P4(a) is to be consistent with the testimony it is necessary that the high level winds at noon on 16 January 1958 to the W-NW of Trindade can have been much stronger than the few knots indicated as the 40-year average at the 200 hPa (~45,000') level. However the mean speeds say nothing about the standard deviation.
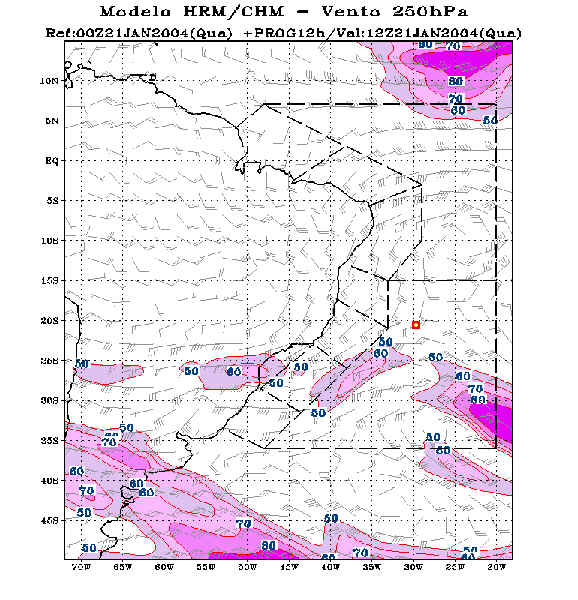
The Brazilian Navy Hydrographic Centre 250 hPa wind forecast for noon on 21 Jan 2004 is shown in Fig.14. This level is about 10,000m or 33,000'. The surface wind (10m ASL) given for noon at the meteorological station on the island (see the meteogram in Fig.17 below) is 6 knots from the ESE, but at 33,000' the wind overhead is 20 knots from the SW. This shear is in the direction expected from the 40-year averages for January-March.
The wind barbs in Fig.14 show that speeds at ~33,000' within a radius of about 250 miles of the island vary between 5 and 50 knots. To the W-NW of the island winds run at 25-30 knots. The zone of winds to the S is projected to reach 80 knots. There is a rather complicated zone of mixing and high level cyclonic rotation around the Trindade area in evidence in January 2004, suggesting a very dynamical weather system in which winds W of the island might sometimes significantly exceed the 25-30 knots indicated here.
|
Fig.14. 250 hPa wind model for 1200 hrs, 21 Jan 2004 (Courtesy Brazilian Navy Hydrographic Centre)
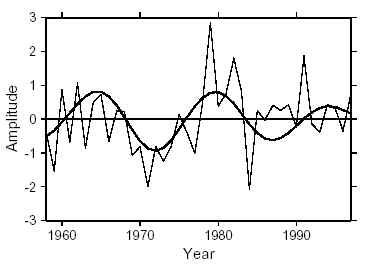
Long term variations in wind patterns may be associated with periodicities in the position and intensity of the South Atlantic Convergence Zone, a tropical convective complex running SE from Amazonia and extending over the sea around the latitude of Rio, a few degrees to the S of Trindade. A ~15 year period in the intensity of the SACZ, identified by Robertson and Mecheso (2000), appears to be negatively correlated with the presence of continental stationary wave eddies that form in the upper troposphere in the lee of the Andes, and with an intensification of winds in the southeast flowing Low Level Jet (LLJ) with which the SACZ is associated. In addition, both a change in intensity and a north-south variation in position of the SACZ have been shown to follow a ~7 year cycle (Boulenger et al., 2002) correlated with rainfall over the southern La Plata basin. A similar decadal cycle in northeastward displacements of the oceanic part of the SACZ appears to be directly driven by sea surface temperature anomalies, a cold-warm/north-south dipole centred a few degrees south of the latitude of Trindade, which is also associated with anomalous winds at low-pressure (and surface) levels. Another independent northeastward displacement and strengthening of the SACZ is found to be associated with cyclical warm ENSO (El Niño/Southern Oscillation) events in the Pacific. (Barreiro & Chang, 2000) Short-term oscillations further modulate intense SACZ events on a scale of days. (Carvalho et al., 2003)
|
Fig.15. Variation in intensity of the summer SACZ (Jan-March), amplitude in standard deviations. The bold curve shows the reconstructed component responsible for the largest part of the variation in the yearly time series, with a period of ~15 years. (Robertson & Mechoso, 2000)
Clearly the weather system in the area is complex, and numerous variables affect the high-level windflow pattern on time scales varying from daily to interannual and longer. Below, Fig.16 isolates (from the model generating Fig.14) the nearest 50 knot 250 hPa contour south of Trindade, tracking several hundred kilometres ENE during 18 hours on 21 Jan 2004. According to Robertson and Mecheso's time series analysis (Fig.15 above), in the Jan-March season of 1958 the SACZ was close to a 1957 period minimum (though only a 1/2 standard deviation negative anomaly), likely to be associated with a relatively wide diffusion of the SACZ and strengthened NW winds in the LLJ bringing humidity from the Amazonia convective zone. Projecting the period forward indicates a likelihood that the 21 Jan 2004 wind field in Fig.14 belongs to a similar phase of the 15-year SACZ cycle. There is therefore some justification for regarding this wind field as at least roughly illustrative with respect to possible wind speeds at 250 hPa on 16 Jan 1958.
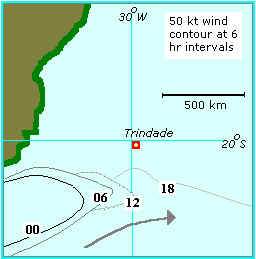
Fig.16. The forecast progress of the 50 knot wind contour at 250 hPa during 18 hours on 21 Jan 2004.
In summary, although nothing definite can be inferred from this exercise given the likely mobility of wind patterns in the area, and an unknown location of the oceanic part of the driving SACZ complex due to ENSO correlations etc., it is reasonable to conclude that winds at a few tens of thousands of feet at noon on 16 Jan 1958 to the W of Trindade could possibly have equalled or exceeded 50 knots and that the probable flow of any such winds would have been towards the NE.
Low level winds
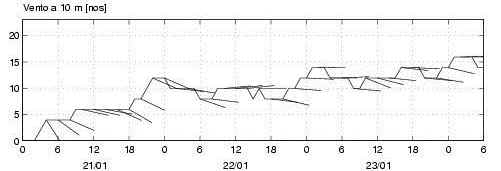
Mean sea surface winds given by Segall (1999) based on high-resolution wind plots for January 15 1999 vary between 4 - 7 m/sec for different regions of the Espirito Santo basin which is bisected by the Vitoria-Trindade Seamount Chain. The trend is an increase towards the W and S of the basin, with values of probably <4 m/sec in the E area nearest Trindade Island, consistent with prevailing light surface winds due to the easterly trades. Similarly a 78 hour projection for 20-23 Jan 2004 by the Brazilian Navy Hydrographic Centre shows (Fig.17) winds at 10m elevation on Trindade Island varying between 0-16 knots SE-E with a mean of 10.2 knots. The easterly flow is shown predominant on the 40-year averaged vector field in Fig.13 up to 850 hPa, or around 4,500'.
|
Fig.17. Forecast wind vectors (knots) against GMT, for Brazil meta-area V, Trindade, at 10m elevation, 21 Jan 2004 for 78 hours.(Courtesy Brazilian Navy Hydrographic Centre)
Therefore, low level cumulus receding W or WNW would match both expectation and the photographs qualitatively, as mentioned. But again the question arises whether likely horizontal wind speeds are sufficient to account for two or three degrees reduction in elevation due to recession in the line of sight.
Vertical air movements also need to be considered at low levels. Up- and down-draughts on the order of 10m/sec. (~ 18 knots) are common in thunderstorm cells, but although storms would probably be common in the area (the Brazilian Navy weather bulletin for 21 Jan 2004 shows isolated thunderstorms and showers in all sea areas) there is no evidence of storm clouds in the photographs. Large-scale subsidence effects are probably too slow to materially alter these clouds, generally operating over periods of hours rather than minutes or seconds. However local lifting/subsidence due to mountain lee waves is possible.
Inferences
cirrus displacement: If the cirrus cloud displacement between photographs P1 and P4 has been correctly identified then a very rough analysis is possible. The angular displacement is approximately 12 degrees. Assuming that the altitude of the cirrus is close to the 250 hPa level (about 33,000') then a 12 degree displacement at a slant range of about 78,000' (about 25 degrees elevation) leads to the range of elapsed time intervals shown in Table 1. below.
speed (kts.) |
interval (mins.) |
30 |
5.4 |
50 |
3.2 |
65 |
2.5 |
80 |
2.0 |
Table 1. Approximate elapsed times between P1 & P4 for several windspeeds, based on 33,000' altitude.
Obviously the cirrus displacement here identified is grossly inconsistent (by a factor 10) with a total photography time of 14 seconds as deduced from the Navy reconstruction according to Barauna. An interval of 14 secs. between P1 and P4 would correspond to a wind speed of about 600 mph.
The figure of 14 seconds was given by Barauna to the press as soon as the story broke - e.g., Ultima Hora, 21 Feb 1958; O Globo, 24 Feb 1958 - nevertheless it was only his personal recollection of a figure arrived at by Navy intelligence during a reconstruction and has probably been misunderstood. The timing of Barauna taking six photographs with the same Rolleiflex 2.8E could only reliably have established a lower bound to estimates of duration, and 14 seconds is consistent with such a lower bound, corresponding to 5 equal intervals of 2.8 seconds to pan the camera, advance the film and operate the shutter. In fact there was acknowledged confusion on deck and Barauna was reportedly being jostled during the two unsuccessful shots. The photos indicate that the photographer moved his position to avoid foreground obstructions, and the object itself went out of sight behind the island at one point. So the figure of 14 seconds should be regarded as a theoretical minimum, possibly far exceeded in practice.
These results are also inconsistent with other estimates of the duration of the incident, which vary between 30 seconds and 1 minute; but perhaps not grossly so. The margin of uncertainty in this study is large, and a factor-two inaccuracy in observer judgements when remembering the duration of a confusing and startling sequence of events would not be very surprising.
Note that reducing the cloud altitude reduces the implied time interval for a given windspeed. For example, if the high cloud layer were at the lowest possible (and, in the tropics, statistically unlikely) altitude for true cirrus - about 20,000' - then a 50 knot wind would suffice to bring the elapsed time below 2 minutes. (As already mentioned, it is even possible that the upper cloud is not true cirrus but shows the effect of strong mid-level winds on a dissolving altostratus/altocumulus layer below 20,000'. But a decision has been taken here not to add any further levels of speculation and approximation by pursuing that scenario. Instead, the speeds and durations in Table 1 should be regarded as upper limiting values.)
In conclusion, within the limits of the approximations used here, it would be possible to argue consistency with a 250 hPa southerly/southwesterly windspeed, roughly normal to the camera optical axis, having a value towards the bottom of Table 1.
cumulus displacement: If the identifiable top edge of the cumulus group is at (say) 4000' then a vertical angular displacement of about 2 degrees would correspond to a horizontal recession in the 4000' plane of more than a mile, and therefore to windspeeds ranging from 10 - 28 knots for the range of time intervals in Table 1. Thus, in this illustration, even the shortest time interval consistent with a realistic cirrus displacement (see above) would imply a horizontal southeasterly or easterly windspeed at the 850 hPa level of around 14 m/sec., which is in the direction of the 40-year average vector but about twice its mean magnitude (Fig 14.).
This may not be especially unlikely. However, vertical air motions may also be significant at low levels, particularly owing to the presence of the mountainous island. If the cumulus-type group is descending between P1 and P4, then the range of values for horizontal windspeed narrows downwards. This might happen due to subsidence caused by mountain waves in the westward lee of the island.
Photo P1 shows especially clearly what appear to be convective clouds associated with the island topography. These are much less evident in most areas of P4, implying a rapid change. Such rapid changes suggest vertical fluctuations in the saturation level. On a day of changeable moist breezes and erratic solar heating (due to broken high cloud) it is reasonable that very local mountain clouds - essentially what are known as upslope or mountain fogs - might form and dissipate on a time scale of a minute or two.
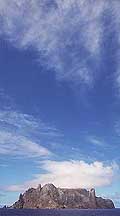
| A photograph of Trindade Island showing the central mountain peaks obscured by a thick cap of convective cloud. This view is from the N, showing the Monument Peak on the right and the Obelisk on the left. The position of the Almirante Saldanha would be behind the headland to the left in this picture. The cloud appears to plume to the right (W) away from the prevailing SE breeze. |
|
Sea-level breezes bring warm, moist air onshore, where it is lifted by mountain slopes to a couple of thousand feet, undergoing adiabatic expansion cooling. Vapour condenses as low cloud over the peaks, pluming over the sea to the NW under the influence of generally SE mid-level winds. As the moisture-laden air slides off the mountains to the NW it is forced to subside again over the sea and adiabatic heating evaporates the cloud droplets.
Given a cirrus displacement consistent with the shorter durations in Table 1, this sort of dissipation would imply a descent of about 300m/min (this is half the rate of the downdraughts common in thunderstorms, or about 5m/sec., in terms of Beaufort numbers a gentle/moderate breeze). More generally subsidence is associated with much slower large-scale motions of air masses falling at 150-300m/hr, but it's the altitude change that's significant rather than the absolute rate. As long as the process is adiabatic the downward forcing of the saturated air by several hundred metres would probably be sufficient to completely evaporate the cloud within a couple of minutes. Broadly speaking, by P4 the foreground 'fog' drops, moves N and dwindles, revealing the high-level cirrus stratification largely hidden in P1.
|
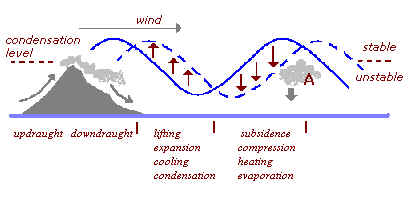
Fig.18. Suggested rippling of condensation level at base of a stable air mass due to propagation of gravity wave. Adiabatic subsidence triggers instability in cloud at A. (vertical scale exaggerated)
A related process could be responsible for more remote subsidence affecting the middle-distance band of cumulus (see Fig.18). Part of the angular fall of this band between P1 and P4 might be bulk subsidence associated with the depressive phase of a gravity or 'buoyancy' wave on the lee of the island, propagating in the stable zone above the condensation level and effectively pushing cloud from the condensation level down into the region of convective instability.
Typically bands of cloud form aligned along the wave fronts of a standing gravity wave. Maintenance of a wave once generated depends on stable air, in which it can propagate over very long distances. But in a convectively unstable zone the wave oscillation cannot survive because displacements of air parcels are not self-correcting. In the hypothesised conditions, with an unstable region below the cumulus condensation level overlain by stable air, the conditions may exist for what can be described as an elevated leaky wave duct that breaks down.
Such a wave represents a net transport of energy and momentum from the mountain to a region where it dissipates, and if it dissipates at A the energy it deposits in the atmosphere can induce turbulence and trigger convection (Hocking, 2001). Here it is suggested that dissipation occurs due to subsidence of the floor of the duct with wave energy 'leaking' by way of an induced instability in the underlying layer. Typical velocity and amplitude of a tropospheric gravity wave would itself probably only result in a displacement measurable in meters per minute; but the off-equilibrium rate of change triggered by it could be rapid, possibly causing the increased raggedness of the cloud band between P1 and P4.
Conclusion
In part 1 it was pointed out that the shadow detail on the island in P1 and P4 indicates an identical solar angle (Fig.19). The hypothesis was introduced that the two photographs might have been taken at the same solar time on two different days. But it was argued that features can be identified in the cloudscapes of P1 and P4 that are sufficiently similar to suggest at least the possibility of development of one from the other. The evidence presented in Part 2 suggests that the time scale implied by such development, with suitable reasonable assumptions about winds aloft, would not be grossly inconsistent with the testimony.
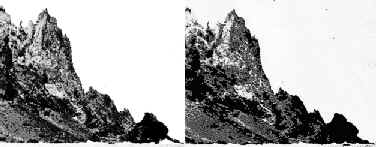
Fig.19. High contrast renderings of detail from P1 (left) and P4. The tonal resolution of the P4 image is coarser because it appears at the edge of the frame, but there is no perceptible difference in the shadow angle.
As a test of the hypothesis that the two photos were taken on different days these results are negative. But the analysis is by no means rigorous enough to falsify the hypothesis. It is true that the comparison of cloud features is subjective, and despite the measured displacement of similar features doubt might remain about the apparent change in texture of a high cirrus layer within the few minutes permitted by any sensible interpretation of the testimony. (Note: No attempt has been made here to take account of possible negative re-processing - 'reduction' with potassium ferri-cyanide to counter a slight overexposure - that may have affected the relative contrast of high-density emulsion areas of P1 and P4.) It is also true that wind speeds at both levels NW of Trindade, whilst physically quite reasonable in terms of the meteorology of the area at large, are required to be some way from likely mean values inferred from the 40-year Jan-March averages for 200 and 850 hPa.
|
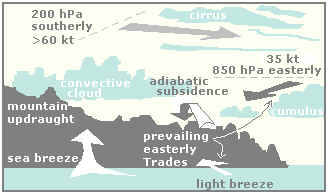
Fig.20. Schematic model of the suggested major weather features
On the other hand there are gross features - such as the placement of the low cumulous-type band, the angle of the striations of the high cloud background in relation to the horizon, the sea conditions, and the location of the photographer on deck (fixed by foreground features not shown here) - which, added to the matching cloud details identified above, all tend to suggest that P1 and P4 probably are photographs of the 'same' altered cloudscape rather than two quite different cloudscapes separated by some exact multiple of 24 hours. If this is accepted as likely then the identical solar angle demonstrated by landscape shadow-detail tends to prove that the alteration must have occurred within a very short space of time, implying the presence of strong S winds at high altitude. This is consistent with internal features of the photographs, particularly the striated appearance revealed especially in P4. Other features of the photographs - particularly the evaporation of 'mountain fog' type clouds noticeable in the foreground of P1, combined with indications of subsidence and convective instability in the cumulus group - are consistent with a moderate or fresh breeze at a few thousand feet overlaying complex vertical processes in the friction layer associated with the island mountains.
The limited purpose of this exercise has been to test the assertion that the two photographs are meteorologically inconsistent with one another and with the testimony. The conclusion must be that there is reasonable doubt that the assertion is true. In the end, of course, only reliable upper air soundings for the date and place in question can prove the case one way or the other.
(last update 25 Feb 2004)
References
Barreiro, M., and Ping Chang, 'Variability of the South Atlantic Convergence Zone as simulated by the NCAR CCM3 Model', NCAR/ASP Summer Colloquium presentation, Dynamics of Decadal to Centennial Climate Variability, Boulder, Col., July 2000.
Bravilian Navy Hydrographic Centre meteorological information http://www.dhn.mar.mil.br/chm/meteo/prev/modnum/modelageming.htm
Carvalho, Leila M. V., et al., The South Atlantic Convergence Zone: intensity, form, persistence, relationships with intraseasonal to interannual activity and extreme rainfall, Institute of Astronomy, Geophysics and Atmospheric Sciences, University of São Paulo, SP, Brazil, 2002
Hocking, W.K, Buoyancy (Gravity) Waves in the Atmosphere, Atmospheric Dynamics Group, Department of Physics and Astronomy, University of Western Ontario, 2001 http://www.physics.uwo.ca/~whocking/p103/grav_wav.html
Mori, Kentaro, http://www.geocities.com/airsmither/trinclouds.htm http://www.geocities.com/airsmither/trind.htm
Petterssen, S., Introduction to Meteorology, McGraw-Hill, NY 1958.
Roberston, A. W. and C. R. Mechoso, 'Interannual and interdecadal variability of the South Atlantic Convergence Zone', Mon. Wea. Rev., 128, 2947-2957, 2000.
Segall, M., Espirito Santo Basin Seafloor Stability and Environmental Study, UFF/EGI Research Pre-Proposal, Energy & Geoscience Institute, University of Utah, 1999.
Sparks, Brad.C., personal communications. (Sparks, founder of the Trindade Project which aims to produce a definitive report on this case, has done detailed photogrammetry and photometry on all aspects of the photographs, including a study of cloud patterns which parallels some of the results reported here.)
US Navy meteorology manual, Aerographer's Mate 1&c, Integrated Publishing (http://www.tpub.com/content/aerographer/14010/)