Analysis of Met. Office
Weather Reports &
Radiosonde Data
Martin Shough
1) General Synopsis
Information from the Met. Office Daily Aerological Records and the Daily Weather Reports for 13/14 August 1956 is tabulated here. Reducing these data with the help of accompanying annotated isobar charts leads to the following synopsis:
A vigorous Atlantic depression has crossed the north of the UK travelling SW-NE towards Sweden, and by the evening of August 13 1956 has become slow-moving, centred off eastern Scotland. By 1800Z the fronts associated with this depression have cleared southern England into the North Sea and the near continent, strong westerly winds have moderated and pressure is now rising. Maximum daytime temperatures in the Suffolk/Norfolk area have been cool, 19-20°C (66-68° Fahrenheit), sunshine having been variable from 1.9 hours on the coast at Gorleston to 7.8 hours inland at Wittering. Intermittent light rain and drizzle widespread in the morning has died out, and since mid-afternoon rainfall at all stations has been only a trace, or just one or two millimetres. Low cumulus or stratocumulus cloud at 2-4000 feet is generally dissolving by 1800Z, along with some coastal patches of altostratus at 10,000 feet and a higher general cirrus layer at 25,000 feet. By midnight all cloud has disappeared. At 2100Z ground is still moist towards the coast and at the low elevation of Mildenhall (near Lakenheath), but dry at the higher inland stations of West Raynham and Wittering. Ground is dry at all stations by 14:0900.
2) Radar Refractivity Profiles
Altitude, pressure, temperature and dewpoint readings from the Hemsby balloon soundings at 13:1402 and 14:0201 have been graphed below together with N-gradient profiles up to the 400mb level. (It should be pointed out that the N-unit values used here were determined by hand using a refractive index nomogram and are to be regarded as approximate.)
a) 13 August 1402Z
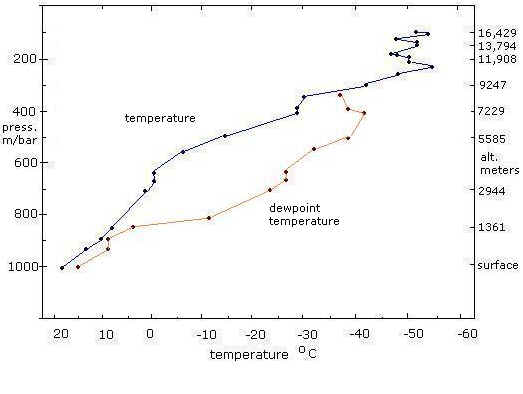
Hemsby altitude/temperature
profile 13:1402
Compiled from radiosonde data in Met
Office Daily Aerological Record
The daytime radiosonde soundings at 13:1402 show that relative humidity at the surface is high at 83%, falling slightly to 77% at about 1800', thereafter climbing to 94% at about 3000' (vapour condensation as cumulus and stratocumulus at this level is indicated in the Daily Weather Reports). Above 4000' RH falls quite rapidly until at about 9500' air temperature and dew point remain constant while pressure falls 27 mb through a band some 750' thick. RH increases quite sharply again at about 24,000', the dewpoint rising three degrees accompanied by a sharp reduction in the temperature lapse rate to zero over a 20-millibar interval. Above a pressure level of 355 mb dewpoint records cease and RH is unknown, but at about the level of the daytime tropopause - recorded as 10,850 m or 235 mb (about 35,590') - there is a 6° temperature inversion across a vertical extent of about 1,140' (41 mb or 350 meters).
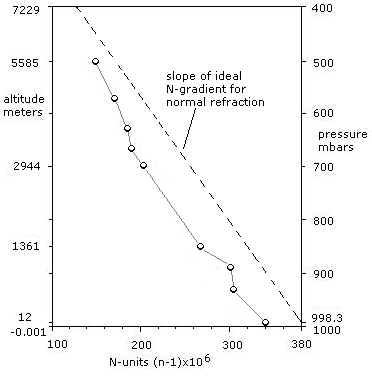
N-profile of refractive index
gradient for Hemsby radiosonde
13:1402Z 1956 (determined using US Navy nomogram).
The above refractivity N-profile has been prepared for this daytime data. N-values for pressures below 500 mb have not been calculated since this is the limit of the nomogram used; however the 4-degree rise in dew-point between 400 and 355 mb suggests a superrefractive layer around 25,000'; otherwise all N-gradients for the layers bounded by recorded heights are within the limits of the 'normal'. Height values for N-gradients of intermediate layers bounded by pressure readings can be determined from a standard 36 mbar/1000ft pressure lapse rate (see Note below), with the result that two low-level layers show N-gradients approaching the limits of normal refractivity. At about 2000' a gradient of only -4 N-units/kft. extends over some 1200' feet, to a boundary where the slope changes to -24 for a similar height during a steep humidity lapse. At -24 N/kft. this is only half the conventional trapping gradient (the curvature of the radar beam is now just equal to the curvature of the earth) but it is possible that a marginally superrefractive layer overlying a marginally subrefractive region at around 4000' would create a weak elevated duct.
Note: The 'standard atmosphere' is of course an arbitrary concept and various pressure lapse rates have been accepted for different purposes. Actual conditions vary widely in four dimensions, and different standards apply over land and over water. Cole [1985] opts for 27 millibars per thousand feet as an average through the first 18,000'. The US Navy favours 45 mbars per kft. Wylie [1952] gives 36 mbar/kft as a widely accepted standard. The latter value is adopted here. |
b) 14 August, 0201Z
The night-time sounding (graphed below) is more relevant and is analysed here in more detail.
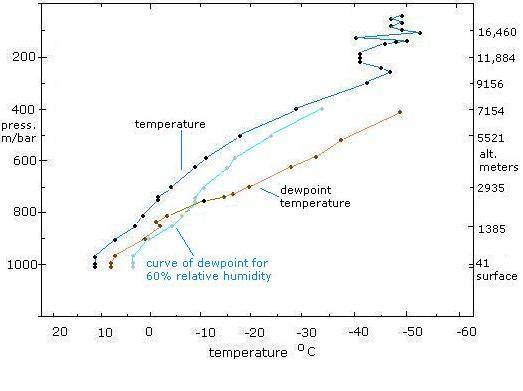
Hemsby altitude/temperature
profile 14:0201
Compiled from radiosonde data in Met
Office Daily Aerological Record
Considering first the low levels: There is no suggestion of a low-level temperature inversion accompanied by a sharp humidity lapse which would indicate surface ducting. At first sight the negligible temperature lapse rate through the first few hundred feet suggests mildly superrefractive conditions, but relative humidity remains high through this layer - about 82% (60% is considered standard) - and in fact the refractive index datasheet tabulated for the N-profile (below) shows a narrow but strongly subrefractive surface layer of about 100' thickness with an N-gradient of about +30 units/kft., overlain by some thousands of feet of refractive index very close to the mean of the brackets for normal refractivity (0 to -24 N-units/kft.). This layer would have an effect opposite to superrefractive trapping and does not suggest widespread AP echoes.
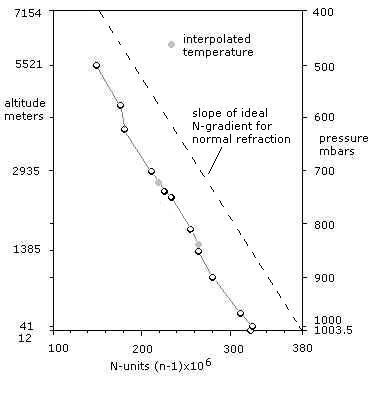
N-profile of refractive index
gradient for Hemsby radiosonde
14:0201Z 1956 (determined using US Navy nomogram).
There is a small but sharp increase in the dewpoint temperature at about 4,500'. It is possible that a humidity change here is associated with a layer of significant refractive index discontinuity. But unfortunately a crucial dewpoint datum at this level has no associated air temperature reading, so relative humidity and refractivity can only be interpolated. There is another missing temperature reading at 730 mb or about 8,500'.
Interpolation is obviously only valid to the extent that continuity can be assumed, which is a theory-dependent proceedure; nevertheless this approximation is the most conservative interpretation. It can be justified by showing that both interpolated temperature values are quite closely bracketed by good readings and that they lie within only 13 and 7 millibars respectively of a fixed pressure/temperature data-point on a curve which generally approximates the slope of a 'normal' N-gradient. (Moreover the contribution of temperature - approximately 1 unit per °C - is small compared to that of the partial pressure of water vapour, which contributes about 75% of the N-variation.) Interpolating the temperatures on the curve leads to values of RH of 33% for the upper level and 80% for the lower level, and to interpolated refractivity values of 220 and 265 N-units, as shown on the N-profile above and in the Table below.
refractive index datasheet |
|||||||||
pressure (mbar) |
height (m) |
temp. (°C) |
dewpoint (°C) |
RH (%) |
N-units |
N-diff. | N-grad. (N/kft.) |
||
1003.5 surface |
12 |
11 |
08 |
82 |
322 |
3 |
+30 |
||
1000 |
41 |
11 |
08 |
82 |
325 |
||||
972 |
- |
11 |
07 |
76 |
315 |
60 |
-14 |
||
900 |
- |
07 |
01 |
66 |
280 |
||||
850 |
1385 |
03 |
-02 |
70 |
265 |
||||
826 |
- |
02 |
-01 |
80 |
265 |
50 |
-10 |
||
813 |
- |
01 |
-03 |
75 |
255 |
||||
751 |
- |
-02 |
-11 |
50 |
233 |
||||
737 |
- |
-02 |
-14 |
39 |
225 |
||||
730 |
- |
-03 |
-17 |
33 |
220 |
||||
700 |
2935 |
-04 |
-20 |
27 |
210 |
||||
622 |
- |
-09 |
-28 |
20 |
183 |
58 |
-7 |
||
577 |
- |
-11 |
-33 |
14 |
175 |
||||
500 |
5521 |
-18 |
-37 |
17 |
152 |
||||
Refractive Index Datasheet for Hemsby
radiosonde 14:0201 August 1956
(Interpolated temperatures and associated RH
and N-values in blue)
In summary, apart from the suggestion of a strongly subrefractive surface layer, which would be expected to reduce the detectability of ground targets, there is no clear evidence of anything remarkable about the nocturnal tropospheric propagation environment. The Hemsby soundings do not necessarily represent accurately the conditions over the whole Suffolk/Norfolk area of course. Nevertheless very similar upper-wind readings from radiosonde releases at Lakenheath and Bentwaters do not contradict the assumption that macroconditions were broadly uniform over the area by nightime on the 13th. This is supported by the surface weather station reports for 13:1800Z and 14:0000Z tabulated here. Microconditions are bound to be less predictable, but inland surface reports from Mildenhall (near Lakenheath) are generally similar to the coastal reports from Gorleston (near Hemsby) with an inferrable lag in the drying of moist ground at Gorleston due to the more recent NE passage of the afternoon shower fronts. (Wittering and West Raynham, further inland, are both already dry by 1800Z.) It is possible that subrefraction due to overlying moist air evaporated from the surface during the mild night was generally well-developed over the fen land, much of which is close to - or even below - mean sea level.
The above discussion refers to the gradients between directly recorded heights. Because this results in rather broad bands it does not represent the vertical profile in any detail. To discriminate gradients on smaller scales one can convert the intermediate pressure readings to approximate heights according to a standard lapse rate of 36 mb per 1000' of altitude. The result of comparing a further 12 pairs of levels in this way is shown below.
pressure (mbar) |
alt-diff. (feet) |
N-diff. |
N-grad (N-/kft) |
1000 |
|||
777 |
10 |
-13 |
|
972 |
|||
2000 |
35 |
-17.5 |
|
900 |
|||
1388 |
15 |
-11 |
|
850 |
|||
666 |
0 |
0 |
|
826 |
|||
361 |
10 |
-28 |
|
813 |
|||
1722 |
22 |
-13 |
|
751 |
|||
389 |
8 |
-20.5 |
|
737 |
|||
1000 |
5 |
-5 |
|
730 |
|||
1200 |
10 |
-12 |
|
700 |
|||
2166 |
27 |
-12.5 |
|
622 |
|||
1250 |
8 |
-6.5 |
|
577 |
|||
2138 |
23 |
-10.75 |
|
500 |
Refractive index table for 12 pairs of heights using conversion factor 36 mb/kft.
This analysis produces 11 N-gradients inside the range (0 to -24 N-units per kft.) of standard refractivity, with a mean of -12.48 N/kft. Only the gradient highlighted, of 10 units across a vertical layer of 13 mb (<300') at an altitude equivalent of 826 mb (about 4800'), exceeds these brackets by a marginal -4 N/kft.
A -28 N/kft. gradient is barely superrefractive. However the 826 mb pressure level at the bottom of this layer corresponds to one of the missing temperature data points, and so the refractive index is in this case calculated from an interpolated temperature. But it is conceivable that a narrow inversion accompanies a 1° dewpoint discontinuity at this level (see 14:0201 altitude/temperature graph above). One could even imagine that this is the reason why the temperature is missing - a highly abnormal reading might have been discarded as erratic. But this is speculation. It can also be argued that a true reading which reduced this N-gradient within standard brackets would at the same time smooth out the opposite tendency (towards marginal subrefraction) that appears in the immediately subjacent layer, and that both these values should be set aside in the absence of a temperature reading.
As it is, one can only confidently say:
that there is no temperature inversion recorded below about 31,000',
that only one pair of levels for which RH values can be calculated shows a marginal indication of a superrefractive gradient,
and that no pair of levels shows any evidence of a trapping gradient (>48 N/kft.).
The Hemsby data nevertheless cannot rule out the possibility that unrecorded sharp changes in refractivity existed over very short distances falling between the samples. Also, at the upper levels dewpoint data are unavailable. At about 31,000' there is a 6° temperature inversion across a vertical pressure difference of 75 mb or about 2000'. (This is below the level of the night-time tropopause which is given as 14,230 m - 141 mb - or over 45,000'.) Reliable N-gradients are not possible here but this layer could well be superrefractive. At a still higher level around 54,000' the air temperature rises 10°C through 11 mb (about 300'), which by rule-of-thumb (36 mb/kft.;1 N-unit/°C), neglecting humidity, would indicate an N-gradient greater than -30N/kft. This value is definitely superrefractive, though not extremely. The true value may well be much greater. However no confidence can be placed in these guesstimates without readings for the humidity gradients through the layers in question.
© Martin Shough 2003